Tag Archives: Sea Level Rise

A Citizen’s Guide to Climate Change, Part I: Temperature

January 30,  2015. Controversy over EPA’s proposed carbon reduction rule (see an earlier post)  has again focused attention on the  climate change debate.  This post will look at global  temperature trends as reported by the National Oceanic and Atmospheric Administration (NOAA) and the National Aeronautic and Space Administration (NASA).

The most recent temperature data. In  2014, the average combined land and sea surface temperature on Earth reached the highest level since modern record-keeping began in the 1880s.   The latest temperature data can be found in the National Oceanic and Atmospheric Administration (NOAA)   2014  Global Climate Report here. Similar results reported by  NASA can be found here. Although NOAA and NASA use somewhat different baselines and methods, the two agencies reached very similar results. NASA calculated an increase of 1.4 ° (F) over the historical baseline; NOAA found an increase of 1.24° (F). Both found that higher ocean temperatures made a slightly greater contribution to the total increase than land surface temperatures.

The  chart below has been adapted from a NOAA Chart showing the ten warmest years on record based on the global average temperature. All of those years, with the exception of one, have occurred since 2000.  The third  column shows the increase in temperature by reference to the historical average (1880-2014).

Rank (1=Warmest) Year Increase (Fº)
2014  +1.24
2 (Tie) 2010/2005  + 1.17
4 1998  +1.13
5 (Tie) 2013/2003  +1.12
7 2002  +1.10
8 2006  +1.08
9 (Tie) 2009/2007  +1.06

Some temperature fluctuation from year to year can be accounted for by El Nino (warming) and La Nina (cooling) trends in the Pacific Ocean, but the 2014 high occurred under neutral El Nino conditions.  Find the original NOAA chart and other information about NOAA’s  2014 temperature analysis here.

NOAA also provides a bar chart showing the trend in global temperature over the entire period

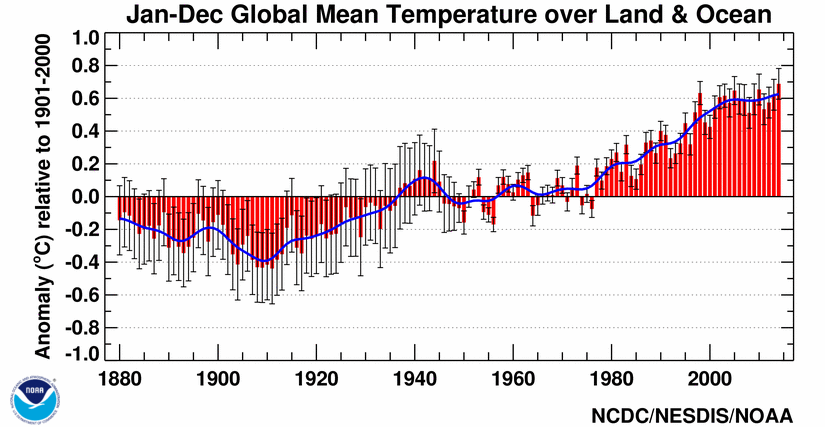
Comparison to past temperature variation on Earth. Scientists have estimated average global temperature during past warming and cooling  periods based on a variety of natural records — glacial ice, tree rings, geological formations, and fossils. There have been periods in the past when Earth’s average temperature was much higher than it is now.  But once Earth cooled down from a hot rock to  a planet capable of supporting life,  the warming event that followed the last ice age occurred  very slowly.  See NOAA’s  introduction to  climate history here.   The overviews of historical climate studies provided by NOAA and by NASA’s  Climate Observatory  put  context around recent temperature increases:

♦  Earth’s average temperature varies from year to year in response to many influences,  but in recent  decades, the cooler years have represented “noise” in an overall upward trend.

♦ Earth’s climate has been relatively stable for much of the history of human civilization (the past 10,000 years).

♦ The last significant warming period (which  began around 11,000  years ago) led to an increase in the Earth’s average surface temperature of between 7° – 12° F.  That warming occurred very gradually  over a period of about 5,000 years and then another cooling trend began.

♦  The current warming trend began in the 20th century and temperature increases are happening  10  times  times faster than the last  ice age  warming period. (NASA).

For more detail on climate history, both the NASA and NOAA  sites provide links to the scientific studies used as references.

Do these increases in global temperature matter?  An increase of 1.4° F over the average global surface temperature seems — and is —  small, but  even small increases can affect patterns of plant and animal life.  In 2012,  the  U.S. Department of Agriculture released an updated U.S.  plant  hardiness zone map.  The map divides the U.S. into  zones based on the average annual low temperature;  going from north to south, each zone on the map represents  a 10° increase in the average low temperature. By comparison to the 1990 map, the new map shows a half-zone shift (or  5° F) toward the warmer zones. USDA has been careful to say the data sets for the 1990 and 2012 maps differed in a number of ways — the new map reflects data from more  locations and use of more sophisticated technology as well as additional years of data.  But the shifts are consistent with the general trend in global temperature data since the 1980s and suggest that farmers and gardeners  may already be seeing changes affecting plant life.

While a  1.2°- 1.4° increase in the average temperature over 30 years may already be affecting   the environment, concern about rising global temperature really focuses on the future. Two of the greatest concerns:

1. The rapid pace of warming and the unknown stopping point. Earth’s last major ice age warming event took place over a period of 5,000 years and at a time before modern human civilization and reliance on large-scale agricultural production.   Earth’s current  warming  is occurring  at a much faster rate (as much as 10 times faster), increasing the risk that plant and animal life may not be able to adapt quickly enough to changing temperature regimes. While Unites States agriculture has not been harmed by  the  1.2 – 1.4 ° (F) increase in recent decades,  it could be much more difficult to maintain agricultural productivity in the face of continuing, rapid temperature increases.  Other, warmer,  parts of the globe will be much more vulnerable to agricultural disruption because of temperature increases. Temperature increases can also   affect other human food sources like fisheries.

2. The chain-reaction effect of rapid warming on other parts of the human environment. The chain reaction talked about most often:

Higher global temperaturemelting of land ice ⇒more rapidly rising sea levelsflooding of coastal areas.

The potential for accelerated sea level rise gets attention because of the direct risk to human populations. In 2010, 39%  of the population of the U.S. lived in a shoreline county;  more than half of the population lived within  50  miles of an ocean shoreline. (Source: U.S. census data as reported in NOAA’s State of the Coast Report.)  As a result, accelerated sea level rise could affect some  of the most highly populated areas in the United States.

Note: NASA’s Vital Signs of the Planet website provides visualizations of  changes in the extent of sea ice and land ice.

How reliable is the data?   Temperature records date back to the 1880s and the amount and quality of the data has only gotten better.  NASA describes the records used in the Goddard Institute of Space Sciences temperature calculations this way:

The GISS analysis incorporates surface temperature measurements from 6,300 weather stations, ship- and buoy-based observations of sea surface temperatures, and temperature measurements from Antarctic research stations. This raw data is analyzed using an algorithm that takes into account the varied spacing of temperature stations around the globe and urban heating effects that could skew the calculation. The result is an estimate of the global average temperature difference from a baseline period of 1951 to 1980.

Next: The role of carbon dioxide and other “greenhouse” gasses in raising global temperature.

The N.C. Coastal Resources Commission, Sea Level Rise and the Military

October 24, 2013. Governor McCrory has made appointments to  the Coastal Resources Commission (CRC).  Six  new appointees  join four existing CRC members whose terms end June 30, 2014 and one legislative appointee, leaving two legislative appointments still to be made to fill  out the 13-member commission. The press release  on the Governor’s appointments can be found here. A complete list of  current members and contact information  can be found here.

The State of Sea Level Rise Policy in North Carolina.  The new Coastal Resources Commission will  be walking into an ongoing debate over whether — and how —  the state should plan for sea level rise.  You can find an introduction to sea level rise  here.  In March 2010, the  CRC’s  Science Panel on Coastal Hazards  released  a  report on sea level rise on the North Carolina coast.  The Science Panel  reviewed data from several studies of sea level in North Carolina and found that the rate of sea level rise on the North Carolina coast  increased  significantly in  the 20th century.  The Science Panel’s N.C. Sea Level Rise Assessment Report  concluded that the data pointed to a likely  1 meter (39 inch) increase in sea level by 2100.  The 39-inch  projection  represented the middle of three sea level rise  scenarios considered by the Science Panel and would be  consistent with simply continuing the recent relationship between temperature increase and relative sea level rise in North Carolina.  The Science Panel issued a brief  addendum  in April 2012 responding to questions about the methods used in the  2010 report.

For comparison: A number of studies have found that the rate of sea level rise along the North Carolina coast  remained at a fairly consistent  4 inches per century for  hundreds of years before turning upward  in the 20th century. Over the last fifteen years,  sea level on the North Carolina coast  has risen an average of 0.12 inches per year —  or  a rate of  over 12 inches per century.

The Coastal Resources Commission began debating adoption of a  sea level rise policy soon after receiving the Science Panel report.  As developed in a series of public meetings,  the draft policy focused on use of the Science Panel’s sea level rise projection as a planning benchmark. One planning consideration will be location and maintenance of  public infrastructure such as water and sewer lines, water supplies, roads and bridges. Even  an increase of twelve  inches per century can be significant  in coastal areas where  low land elevation, wave action and increased shoreline erosion magnify the flood impact of rising water levels.  (In the next section, you will find a link to  a  National Oceanic and Atmospheric Administration  sea level riser viewer that allows you to see the  land area flooded at different increases in sea level.) The draft policy  did not  propose  any new regulation of private development.

Both the Science Panel report and CRC discussion of a draft sea level rise policy generated opposition  from  coastal  developers, realtors and some local government officials. That opposition led to legislation,  Session Law 2012-202, barring any state agency other than the Coastal Resources Commission from adopting a rate of sea level rise for regulatory purposes and preventing the CRC from taking any regulatory action  before July 1, 2016.  In the meantime, S.L. 2012-202 directed the Science Panel to provide an update of the 2010 report on sea level rise by March 1,  2015.

In response to concerns about  the Science Panel’s  projection,  the CRC removed references to any specific rate of  sea level rise from the draft policy.  In August 2012, the CRC voted  to send the  policy out for public comment as a proposed rule.  The policy then got caught up in a debate  over the appropriateness of  going through rulemaking on a policy that had no regulatory impact.  At the end of  the Perdue administration, the sea level rise policy  remained in rulemaking  limbo. One question for the newly appointed Coastal Resources Commission will be whether  to  revive discussion of planning for sea level rise on the North Carolina coast.

Overlapping the Science Panel’s work,  in 2009 the N.C.  Division of Emergency Management (DEM) began a Sea Level Rise Impact Study  under a  $5 million grant from the National Oceanic and Atmospheric Administration (NOAA).  The  DEM study was designed to look at the impact of different sea level rise scenarios on  natural  resources  and the built environment.  In 2012, the DEM study also met opposition. Political pressure  reportedly  caused DEM to back away from using the Science Panel’s projection (a  39-inch  elevation in sea level  by 2100)  as the worst case scenario in the Impact Study.  (See a May 2012  story by Charlotte Observer reporter Bruce Henderson.)  I have not been able to confirm the range of sea level rise scenarios to be included in the final Sea Level Rise Impact Study.  DEM had  planned  to complete the study by the summer of 2013, but  has not yet released a report. You can find the DEM webpage for the study here.

New Information on Sea Level Rise.  While North Carolina’s sea level rise planning efforts  have stalled, other scientific and planning organizations  continue  to collect sea level rise data, project sea level rise impacts and  develop plans to adapt to rising sea levels.

A  NOAA website showing the potential effect of sea level rise now includes the North Carolina coast.  Maps developed by NOAA’s  Coastal Science Center show  areas  inundated as sea level rises. You can find the sea level rise viewer  at http://www.csc.noaa.gov/slr/viewer/.  To see a visualization of sea level rise on the North Carolina coast, choose North Carolina under the “zoom in”  function on the right-hand side of the webpage.  Once the  aerial photo of the state appears, use the sea level bar on the left-hand side of the webpage to select a  sea level. The bar ranges from current sea level up to 6 feet above  current levels.  With each increase in sea level, the map  shows the land  area  flooded by the encroaching waters of the Atlantic Ocean and coastal sounds.

The most recent report of the International Panel on Global Climate Change, issued in September,  estimates global mean sea level will rise between10 and 32 inches by the end of the century. Those numbers represent an increase over mean sea level rise projections included in the 2007 IPGCC report.   Yale Environment 360, a  publication of the Yale School of Forestry and Environmental Studies, just published a helpful summary of the new  IPGCC report  on sea level rise here. Sea level does not rise at the same rate on all coastal shorelines, however,  and the N.C. Science Panel report explains why  relative  sea level rise on the North Carolina coast will likely be higher than the global mean sea level.

Coastal Military Bases and Planning for Sea Level Rise.  North Carolina has  a number of    military installations  in the coastal area.  In 2010, the Department of Defense (DOD) Quadrennial Defense Review for the first time identified global climate change as a national security concern because of the potential impact on U.S. military installations around the world.  DOD had begun to focus on  the impact of sea level rise on coastal military bases even earlier out of concern that  changes associated with sea level rise (more rapid coastal erosion, rising water tables and salt water intrusion in aquifers)  have the potential to impact  military infrastructure and training facilities.  A 2008  National Intelligence Council assessment concluded that 30 U.S. military installations were at risk of damage from rising sea level.

Some DOD sea level rise assessments have looked specifically at  N.C. military installations. A  2009  sea level rise risk assessment for  DOD  modeled shoreline changes at coastal installations in N.C.  in response to different rates of sea level rise. The consultant’s report  used the Air Force Dare County Bombing Range as an example of the results — between 58% and 100% of the land area of the bombing range could be lost to shoreline changes in response to projected rates of sea level rise. DOD’s environmental research arm, the Strategic Environmental Research and Development Program (SERDP), has several  projects underway to evaluate the impact of climate change and sea level rise on  U.S. military installations.   One SERDP project involves  N.C’s Camp Lejuene Marine Corps Base in Onslow County. You can find a description of the SERDP projects here.

Going in Different Directions?  Setting aside debate about the cause, the U.S. Department of Defense has chosen to assess the vulnerability of coastal military installations to sea level rise and actively plan for those impacts.  The practicality of managing  sea level rise at existing military installations  may  become a factor in future Base Realignment and Closure (BRAC) decisions.  The military’s  response to sea level rise  could have significant implications for North Carolina since seven of the state’s eight military installations are located at the coast.  (Fort Bragg is the one exception.)  But as DOD moves to understand and  plan for  sea level rise, N.C.’s political leadership has turned away from sea level rise planning.  Given the large economic footprint of the state’s military installations (see a 2013 report for the N.C. Department of Commerce), state leaders have increased efforts to support  the military presence in the state.   Right now, those efforts don’t  include cooperative planning  for  sea level rise, but that may become important.